
Time to first byte is the metric everyone quotes because it is easy to measure and easy to compare. Used well it is a fine instrument. Used alone it flatters the wrong things.
What it measures
The clock runs from request start to the first response byte: DNS, connection setup, TLS, edge processing, and, on cache misses, the whole trip to origin. A low TTFB means the edge was close, the connection warm and the cache hit. Its popularity is earned: no other single number correlates as conveniently with how fast a site feels to a first-time visitor on a cold connection.
What it hides
A brilliant TTFB on a cache hit says nothing about the misses, and users experience the tail, not the median. It also says nothing about throughput: video and large downloads live and die on sustained transfer, where first-byte heroics are irrelevant. The flattery problem is structural: any metric that improves when caching succeeds will be gamed by measuring the pages that cache best, sometimes innocently, sometimes not.
TTFB also carries an SEO significance worth stating precisely: it is the foundation under Largest Contentful Paint, one of the field metrics Google grades. A slow first byte delays everything downstream, no rendering optimization can recover time the network already spent, which is why TTFB improvements propagate through the whole vitals report. The relationship runs one way: good TTFB does not guarantee good LCP, since heavy pages can squander a fast start, but bad TTFB reliably guarantees bad LCP. Fix the foundation first; it is the only order of operations that works.
Using it properly
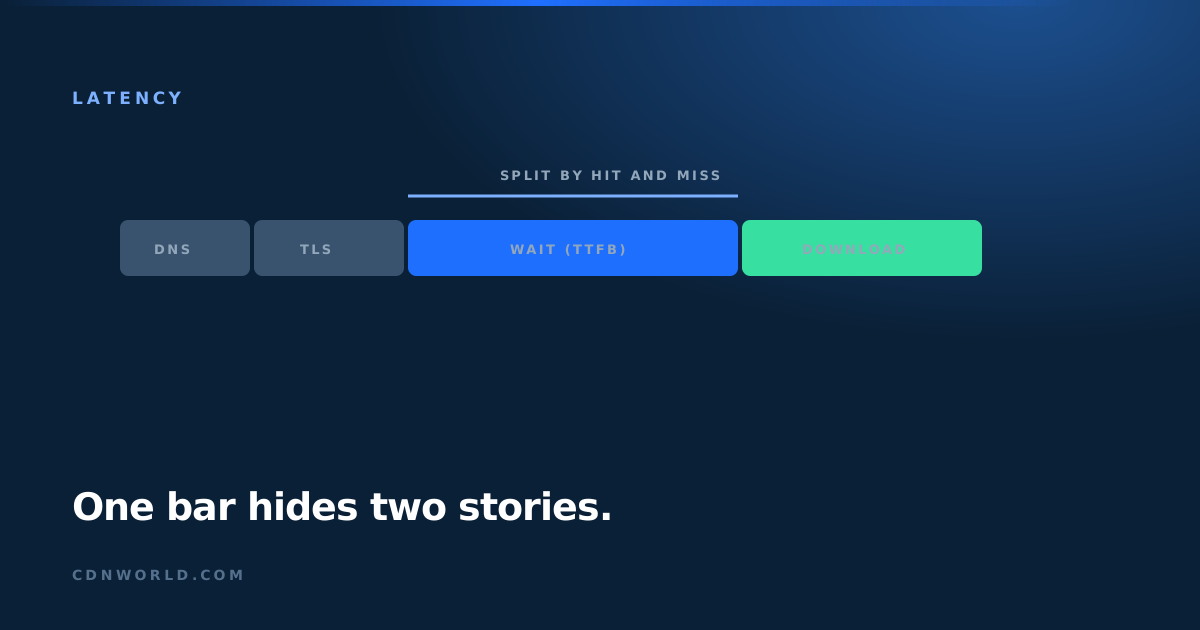
Split TTFB by hit and miss, watch p95 not average, and read it beside cache hit ratio. A provider comparison on blended TTFB alone mostly compares cache luck. The pairing of miss-TTFB and hit ratio predicts real experience far better. The hit-and-miss split also localizes problems: a good hit TTFB with a terrible miss TTFB points at origin distance or shielding, while the reverse points at edge configuration, and the blended number points at nothing.
In practice
Add two lines to your dashboard this week: TTFB split by cache status, at p95, per major region. The first week of that data usually contains a surprise, most often a region or content class quietly suffering behind a healthy blended average. Fixing what the split reveals is routine work; discovering it without the split is luck.
The speed receipt on every page of this site measures your own TTFB, live. The assessment measures your users’.