
Dashboards summarize; log lines testify. Every request that touches the edge leaves one line recording what arrived, what the cache decided, how long each part took, and what went back. Learning to sight-read that line — the way a DBA reads a query plan — is the single most transferable delivery skill: dashboards differ per vendor, but the grammar of a log line is nearly universal. The collection guide covers getting logs; this one covers reading them.
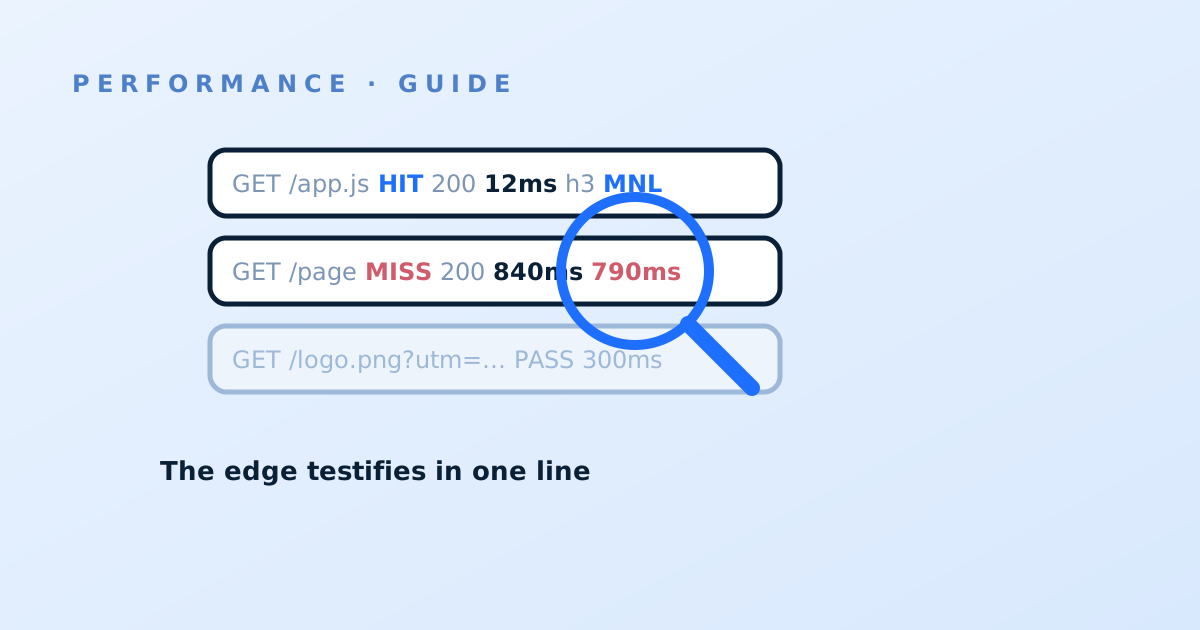
One line, one request, whole story
A typical edge log line carries: timestamp, client IP (or a privacy-safe truncation), method and full URL with query string, status code, response bytes, cache result, one or more duration fields, protocol and TLS version, the serving location, and the request's User-Agent and Referer. Vendors name these differently and let you add more, but the anatomy repeats. The mental shift that makes lines readable: each is an edge-side record — durations are measured at the edge, the URL is post-normalization (what the cache actually keyed on, which is why log lines are the ground truth for cache-key audits), and one user page view fans out into dozens of lines, one per asset.
Cache status and its dialects
The cache-result field is the most valuable column and the most dialect-ridden. The core vocabulary: HIT (served from edge storage), MISS (fetched from origin and typically stored), PASS or DYNAMIC or BYPASS (deliberately not cached — configuration said don't), EXPIRED or REVALIDATED (was stored, TTL lapsed, checked with origin — a cheap 304 conditional if validators are set), and STALE or UPDATING dialects (served old content while refreshing, i.e. serve-stale working as designed). The reading habit that matters: distinguish "miss" from "pass" religiously. Misses are a tuning problem — the object was cacheable and wasn't there. Passes are a policy statement — and a surprising volume of PASS on things that look static is how sites discover a cookie or header quietly disabled caching estate-wide.
The timing fields: total vs origin
Most platforms offer at least two durations, and the pair is the point: total request time (arrival to last byte sent) and origin or upstream fetch time (edge asks origin, origin answers). On a HIT the origin field is empty or zero — as it should be. On a MISS the two together attribute every millisecond: origin time belongs to your application and its network path; total minus origin is edge processing plus delivery to the client. This pair is the log-side half of the decomposition in the TTFB guide: client timing tells you the user's experience, these fields tell you which side of the edge caused it. One subtlety worth knowing for your platform: whether total time includes delivery to a slow client (it usually does), because a "slow" line with fast origin time and huge bytes may just be a phone on 3G doing its best.
Bytes, protocol and the POP
Three supporting fields turn good reading into fluent reading. Response bytes, read against the URL, catches compression failures (a text asset logging ten times its compressed size), unversioned assets being re-downloaded, and the one giant object dominating a bill. Protocol and TLS version give you adoption by population — your HTTP/3 share and any lingering TLS 1.2 clients — measured on real traffic, no instrumentation needed. And the POP or serving-location code answers "where was this user served from?", which is how you catch routing surprises: a Manila user consistently logged at a US west-coast location is a peering story that no origin optimization will fix. Percentile any duration by POP and you have a free geographic performance report.
Sight-reading: three worked lines
Three shapes to internalize. A line with HIT, 12 ms total, no origin time: the system working; thousands of these are the background hum. A line with MISS, 840 ms total, 790 ms origin: the edge added 50 ms and your origin owns the rest — an application ticket, with the URL attached. A line with PASS, 300 ms, on /logo.png?utm_campaign=spring: nothing is broken and everything is wrong — policy is refusing to cache an obviously static object, probably over query strings or cookies, and a rule change would convert that population to 12 ms hits. When a page is slow and nobody knows why, pull its lines and read them in order; the answer is usually in the third column you look at, and the triage guide turns this reading into a repeatable drill.