
A user in Lagos, Manila or La Paz on a mid-range Android over cellular does not experience a slower version of your site — they experience a different one, shaped by round-trip times in the hundreds of milliseconds, radio-network loss, device CPUs that chew JavaScript slowly, and data plans priced by the megabyte. Delivery engineering for these markets is its own discipline, and its wins are large precisely because the baseline is so hard. It also has a pleasant property: everything that helps the far user helps the near one too.
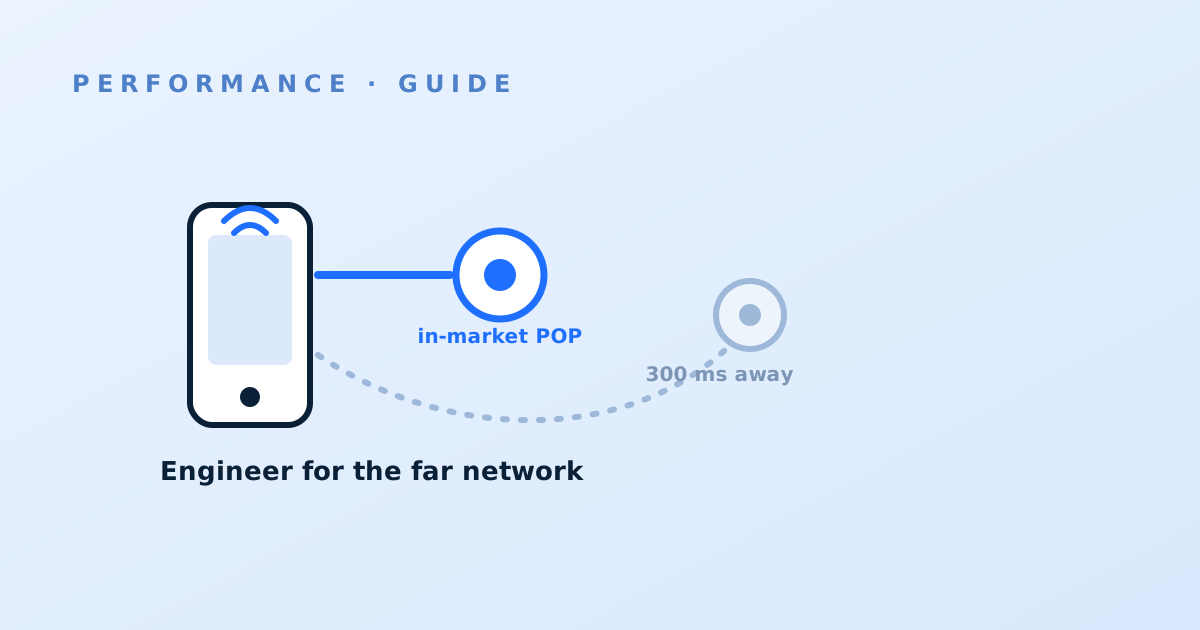
The far-network reality
Four compounding factors define the environment. Distance: if the nearest POP with your content is a continent away, every round trip costs what physics charges, and page loads are made of many round trips. Loss: cellular radio drops packets as a matter of routine, and loss interacts brutally with TCP's congestion control — throughput collapses far below the link's nominal speed. Devices: the median phone is not a flagship; parse-and-execute time for heavy JavaScript can exceed network time. And data cost: in markets where a megabyte has a visible price, page weight is not just latency, it is literally your user's money. Each factor points at a different section below; the estates that win address all four.
Presence and routing: check the map against the truth
Provider coverage maps show dots; what matters is whether your traffic is served from those dots. Local presence can be nuanced — a POP may serve only some ISPs, only some products, or exist mostly for the map — and interconnection matters as much as presence, since a POP in-country that reaches your user's ISP through a distant exchange buys little — a nuance the coverage-map guide treats in depth. Get the truth empirically: the POP code in your logs tells you where each market's users are actually served from, and RTT percentiles by market tell you what it costs them. If a priority market consistently serves from the wrong continent, that is a conversation with your provider first — routing and coverage change more often than pricing pages do — and, unresolved, one of the honest reasons for a regional provider or a multi-CDN posture with a specialist handling that geography.
Protocols for lossy paths
Protocol features are worth more per unit on lossy, high-RTT paths than anywhere else, which reorders your priorities. HTTP/3 earns its keep here: QUIC removes head-of-line blocking at the transport layer, so one lost packet no longer stalls every stream on the connection — precisely the failure mode of HTTP/2 over lossy radio — and its faster handshakes and connection migration (surviving a switch between Wi-Fi and cellular) are built for mobile life. TLS resumption matters doubly when every round trip costs 300 ms. And connection reuse deserves an audit: asset sharding across many hostnames, an old HTTP/1 habit, forces extra DNS lookups and handshakes that far-network users pay for at full price; consolidate onto few hostnames so one warm connection carries the page.
Payload economics: bytes are money
On a 3G-class link, transfer time is nearly linear in bytes, so the payload budget is the performance budget — and the data-cost lens makes it an ethics budget too. The delivery-layer levers, in impact order: images (the majority of most pages' weight) served through edge image optimization — modern formats, device-appropriate dimensions, honest quality settings; maximum-effort text compression, where precompressed Brotli at its highest level is pure win for static assets; and a hard look at JavaScript weight, which taxes these users twice — once in transfer, once in parse time on a modest CPU. Set a per-template byte budget measured on the mobile variant, alert on regressions, and treat every third-party tag as a purchase someone must justify: each one bills your poorest users first.
Measure there, not from here
Nothing about these markets can be understood from a European office on fibre, and only partially from synthetic agents in the region's data centres — the last mile is where the truth lives. RUM, segmented by market and network type, is the ground truth: p75 and p90 per country, page-weight distributions, protocol adoption (is HTTP/3 actually negotiating on those carriers?), and the effective-connection-type signal browsers expose. Where traffic volume is thin, raise the sampling rate for those segments rather than accepting unreadable percentiles. Then run the improvement loop against those dashboards specifically: every change in sections two through four should move a far-market percentile you can name, and the ones that don't get reverted or rethought. Teams that adopt the far user as their reference user find the near markets improve as a side effect — the reverse is never true.